Poverty reduction by private sector development in Rwanda
How to realise Vision 2020 even in global recession?
In this paper is analysed: what might be done to realise Rwanda’s main target, a decrease of poverty from 55% in 2006 to less then 30% in 2020 with the constraint that the foreign reserve stock does not decrease and government deficit stays below 3% of GDP?
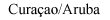
This analysis is done using the New Macro Model Rwanda & Poverty Module. The result has been presented by the participants in the model training to the Management on 17 and 18 December 2009. See photos.
Some of the members of the Macroeconomic Working Group (see full list of participants in table next page) after presenting the model and scenario 2020 to Ms. Kampeta Pitchette Sayinzoga (Permanent Secretary Minecofin) on Friday 18 December 2009.
From left to right: Mugwaneza Pacifique (Minecofin/Macro), Kubwimana Rose (NBR Monetary division), Mpayimana Fabien (NISR Ec. Statistics), Nyirakanani Regine (NBR Research Policy Dep.), M Kabanda Florence (RRA Planning & R Dep.), the chairman of this group: Obald Hakizimana (Minecofin/Macro), Ncuti Clement (Minecofin/Budget), Bateman Jonathan (Minecofin/Budget), Ntare Bright (CEPEX), Karakye Charles (Minecofin/Budget), Mutuyimana Jean Pierre (NBR Monetary policy division), and sitting in front behind PC: the co-ordinator of this group: Placide Muhirwa (Minecofin/Macro)
To be able to do this impact analysis we first need to develop a calculation framework consisting of assumptions (policy measures) that go as input into a macro model. The model contains the relations within and between the fiscal sector, external sector, real sector, monetary sector and household sector. The household sector needs to contain a breakdown of the numbers of household and incomes into main categories as wage earners, self-subsistence agricultural sector, informal sector etc. Then the growth of numbers and incomes of the several groups has to be translated into a poverty module, to calculate the change in the numbers below the poverty line. The scheme below provides an idea what we have in mind.
The scheme consists of three parts. The left part reflects the policy assumptions like the change in the savings rate, change in population growth, higher productivity growth, tax policy, exchange rate, investments government etc.
The middle part shows the relations within and between sectors, i.e. the macro model. For example, wages influence prices and prices the wage rates. Government deficit affects money supply and the same for deficit on BoP. A crucial variable is the cost price: if the domestic cost price is lower then the export price, that will stimulate volume growth of exports. And a lower domestic cost price compared to import price will stimulate domestic production. So lower cost price results in higher GDP. The cost price is the result of import costs, indirect taxes, plus wage rate minus productivity growth.
The third part to the right is the poverty module. In that module the change in numbers and income to socio-economic groups is translated into the share of households below the poverty line.
Should we have such a combination of policy assumptions, macro model and poverty module, loaded with the accurate data and the accurate coefficients in behavioural relations, then we are able to answer the question of how to realise Vision 2020.
However, economic science is not developed so far that we know exactly how the economy works and the data are estimates. So there is no model to proof exactly how policy measures via several channels at the end will affect poverty.
But one can try to construct a model & poverty module that reflect the Rwandan economy as good as possible to get an idea of how policies affect poverty.
Actually that is what MINECOFIN decided. The Rwandan government established a macro model team in August 2009 consisting of economists from the Macro Economic Policy Unit and the Budget Unit of MINECOFIN, National Bank Rwanda, Rwanda Revenue Authority, National Institute Statistics Rwanda and CEPEX. The macro model team, supported by a consultant (Dr. Marein van Schaaijk, Director of Micromacro Consultants and Stephen Chong poverty specialist of that bureau) created step-by-step a combination of assumptions, macro model and poverty module from scratch in three sessions of workshops of each two weeks in September, October and December 2009.
First the structure of the new model was discussed based on a demo macroabc model and the Financial Programming files of Rwanda, both running in Excel. Then we started from scratch with an empty sheet. First the formulas have been discussed, using the white board, then one of the participants (the ‘’driver’’) brought the formulas in his draft model file in a notebook with overhead projection, so all participants could see what happened. Then in the third step the new formulas were cleaned and the model file distributed to all participants. Then each (group of) participants did the same again in its own computer. So the whole model process went through the hands of the participants.
First a data consistency framework was made, including all needed variables and definition relations. Then we injected row by row the behavioural equations, using knowledge of the several specialists in the model team. In the third stage the model was tested by running many baselines till 2020 and also variants and scenarios till 2020.
The new model is close to the Financial Programming of IMF, but with three additional things: a) a household sector (data from Household Surveys), b) a poverty module, and c) behavioural equations including the role of incentives (cost price, productivity).
Once the model was tested, first a technical baseline was made based on trend assumptions in the model version with exogenous exports and imports: export volume 13 % last 9 years, investments 11%, just as the average of last nine years. Later this was replaced by endogenous exports (international trade, difference between export price and cost price, trend equal to residual last 9 years) and investments (follows the growth of real GDP of last years plus trend equal to residual last 9 years), but in the technical baseline that gave on average the same growth rates as in the case of the exogenous exports and investments. In the baseline the depreciation was set on 1% a year, the average of last 9 years.
This technical baseline shows a decrease of poverty to 34%, so too high compared to the target of 30 in Vision 2020. Furthermore the BoP shows a non-sustainable deficit. So either a package to prevent the foreign reserve stock has to be injected, or the depreciation of the exchange rate will be much higher then 1% a year as in the baseline.
Then the team ran several variants to arrive at a result of 30% below the poverty line including no decrease in foreign reserve stock. The table below gives the results of 8 variants. This exercise demonstrates that productivity growth is the main road to poverty reduction. But higher savings, higher direct taxes and depreciation of the exchange rate are needed to prevent the foreign reserve stock to become negative.

The combination of the 8 variants in the table above realises the targets. It also results in a share of donor aid in government total revenues to go down from 45% in 2008/9 to 25% in 2020/21. So the package also realises less dependence on foreign aid.
Please realise that the assumptions are input to the model. Thanks to the what if simulations we found what levels of productivity growth etc. are needed. Next question is how to realise that. The answer on that question requires other then macroeconomic expertise. So other experts need to be invited too.
One might think of a mixture of policy measures like:
- Enabling business environment
- All Government activities reshuffled from viewpoint how they contribute to higher productivity in private sector (better roads, better-educated employees, high speed in providing licenses to starting firms etc.)
- Decrease of other Government activities, resulting in lower taxes without increase of Government deficit
- Promote foreign direct investments, and take care that technology transfers take place
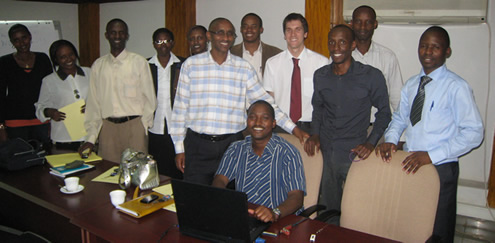
Participants get Attendance Certificates Ms. Kampeta Pitchette Sayinzoga (Permanent Secretary Minecofin):
Ms. Kampeta Pitchette Sayinzoga (Permanent Secretary Minecofin) has given attendance certificates to the participants on Friday 18 December 2009. On this photo she (left) gives the certificate to Obald Hakizimana (right), and in front the co-ordinator of this group Placide Muhirwa (Minecofin/Macro)
Conclusion
A macro economic model team of economists from MEPU MINECOFIN and several other institutes has constructed a new macro model of the Rwandan economy and a Poverty Module. This model can be used in the preparation of the Budget Framework Paper, the Annual Economic Report, update of the EDPRS and Vision 2020, monitoring and impact analysis. In this paper we have shown how this model might be helpful to find a mix of policy measures to realise the Vision 2020 targets even in case of the global recession.
Because this model includes crucial behavioural equations including the role of cost prices and productivity, it is able to show how private sector development can give sustainable decrease of poverty.
The model runs, but some data and coefficients are inaccurate, so research is needed to improve this step-by-step during the coming years. Furthermore also the expertise of other then macro economists is needed to translate assumptions concerning additional productivity into realistic policy measures that will realise that.
Because of the pro private sector policy, Rwanda is an interesting place for foreign direct investments.
|