|
European Union - Euralyse
Table of contents:
|
Introduction
Euralyse is a macroeconomic
model of the European Union as a whole. The model structure is more or
less similar to the structure of Macroabc, a macroeconomic model for
the Netherlands. More information on Macroabc is available in Dutch at
the homepage of Micromacro Consultants (Follow the link Draaiboek
Macroabc or click here).
Euralyse consists of all macroeconomic variables occurring in Macroabc,
plus extra variables like short and long rate figures, the exchange
rate and an European index for the stock market.
It is the impression of Micromacro Consultants (MMC) that these
financial variables can not be forecasted properly and unconditionally.
In other words: we prefer to leave this area to diviners and technical
analysts. It is as difficult to forecast precisely interest and
exchange rates as to predict the amount of millimetres rain to be
fallen in Brussels tomorrow. However, it is a common fact that the
average temperature in Brussels is significantly lower in December than
in July. In the same way, Euralyse does not predict interest and
exchange rates. Instead, Euralyse will show in which ways these
quantities influence the economy and vice versa, the ways in which the
economy can affect such variables.
Macroabc is designed as a tool for Dutch economists specialised in
macroeconomic analysis. Euralyse, on the contrary, will be made
accessible to a far larger public. Two model version will become
available: a scientific version intended for European macroeconomists
and a popular version. In the scientific version the user is assumed to
master the model completely and to run simulations on the basis of
his/her own insights.
The popular version of Euralyse contains a 'peel' enabling users to
start with simulations without studying the model as a whole. You can
work with this user-friendly version of Euralyse in case you do not
wish to absorb all details of the model relations and its variables.
It is not possible to determine scientifically the scenario approaching
the realisation figures most closely. That is why the popular model
version will present the results of twenty variants for several
scenarios.
Furthermore, Euralyse will supply historical data series for all main
macroeconomic variables of the European Union, consisting of fifteen
member states. These time consistent series allow you to compare your
simulations with developments in earlier years.
Euralyse will be presented in December 1999 during a workshop on
European macroeconomics. Next year we intend to develop a self
explaining slide show on CD-rom.
We would be pleased to inform you when the English version of this
CD-rom will be available. If you wish so, please send us your e-mail
address and you will be acquainted without any obligations.
Furthermore, we are looking forward to receive any questions, comments
and suggestions you might have. |
What is Euralyse?
Euralyse is a macroeconomic
model of the European Union based on the Macroabc methodology of MMC.
This is a flow of fund model based on the core of the large
macroeconomic models of CPB. The database stems from the Organisation
for Economic Growth and Development (OECD) after CPB improvements.
A first version of the model
is already presented in workshops in December 1999. However, the work
on the scientific version has to be finalised yet. After finalisation,
one can use Euralyse in research analysis, historical simulations,
policy simulations, forecasting and monitoring of the European economy.
The model is kept as simple as
possible deliberately and is very easy to handle. However, it contains
the most important economic relationships. With the help of a manual
you can teach yourself to run the model by yourself, using data of the
European Commission (EC), Eurostat and the Organisation for Economic
Cooperation and Development (OECD). The prerequisites necessary to run
Euralyse successfully are a sound knowledge of economics and some
experience using spreadsheets on a personal computer.
Euralyse can be a useful tool in a whole range of activities. Examples are:
- Policy variants:
calculate yourself what will be the economic consequences of exogenous
changes (international inflation etc.) on the economy: what are the
effects on the economy if total wage costs will be 1 per cent higher
than the European Commission is predicting? What will happen if the
interest rate will be one per cent higher?
- Historical analyses: in
which way did the European economy develop itself in the past and in
comparison with now? Euralyse contains consistent time series from 1975
to today.
- Medium term and long
term simulations: you can easily design a new medium/long term path of
reference for the period 1999 to 2020 or even further ahead. You can
use that new path as a basis for scenarios.
Since the Second World War
Europe is integrating continuously. Especially the start of the
European Monetary Union in 1999 brings the EU member states even closer
together. It is against this background that we started to build a
model for the European Union using the Macroabc technology. We consider
the European Union as one ‘country’ in order to obtain
comparable data.
Euralyse can be applied as an aid with research analyses and scenario building.
|
Background of Euralyse
The structure of
Euralyse stems from Macroabc, a macroeconomic model for The Netherlands
developed by Micromacro Consultants. The methodology of Macroabc
consists of constructing an analytical framework that uses the data
from a compact macroeconomic database.
Macroabc is an integrated
data, forecasting, and simulation model based on the core of the macro
models of the CPB. It is a so-called aggregate demand, aggregate supply
model (AD-AS model) that combines modern macroeconomic theory with
pragmatic modelling. It is easily adapted to fit the institutional and
behavioural relationships in other countries. The macro models of
Surinam ‘Macmic’, of Curaçao ‘Curalyse’ of Poland ‘M98D’ and Kenya
(Kenyabc) are based on the Dutch Macroabc methodology. The ability to
run a model in a standard spreadsheet increases an accessibility of a
model. In particular, because the spreadsheet models do not require
intensive and specialised training in detailed computer programming
languages, policy experts can participate more in model construction
and execution.
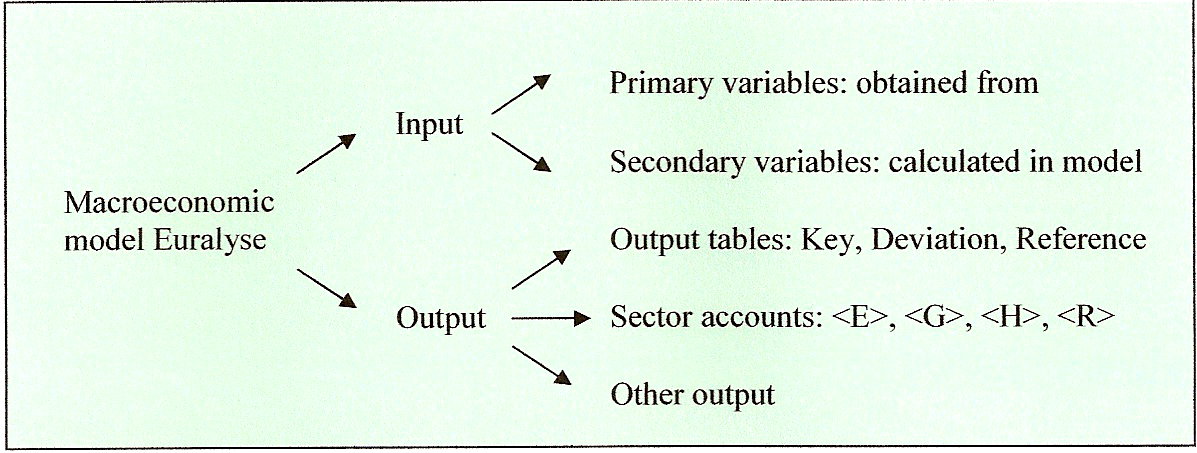
The essence of Euralyse is that the whole
spreadsheet of some 1000 lines is being filled on the basis of 57
primary variables only. On the basis of these primary variables the
secondary variables are calculated.
The model output consists of
several output tables, sector account and other tables. Since Euralyse
is available in Excel’97 format, the model is quite accessible.
Figure 1.1: Rough sketch of Euralyse

|
Main Structure
An
economic model in spreadsheets is very flexible and useful since
changes are easy to make. However, flexibility can take a turn into
chaos. You run the risk of loosing the survey. You have to take care
yourself of the arrangement in spreadsheets. That is why it is
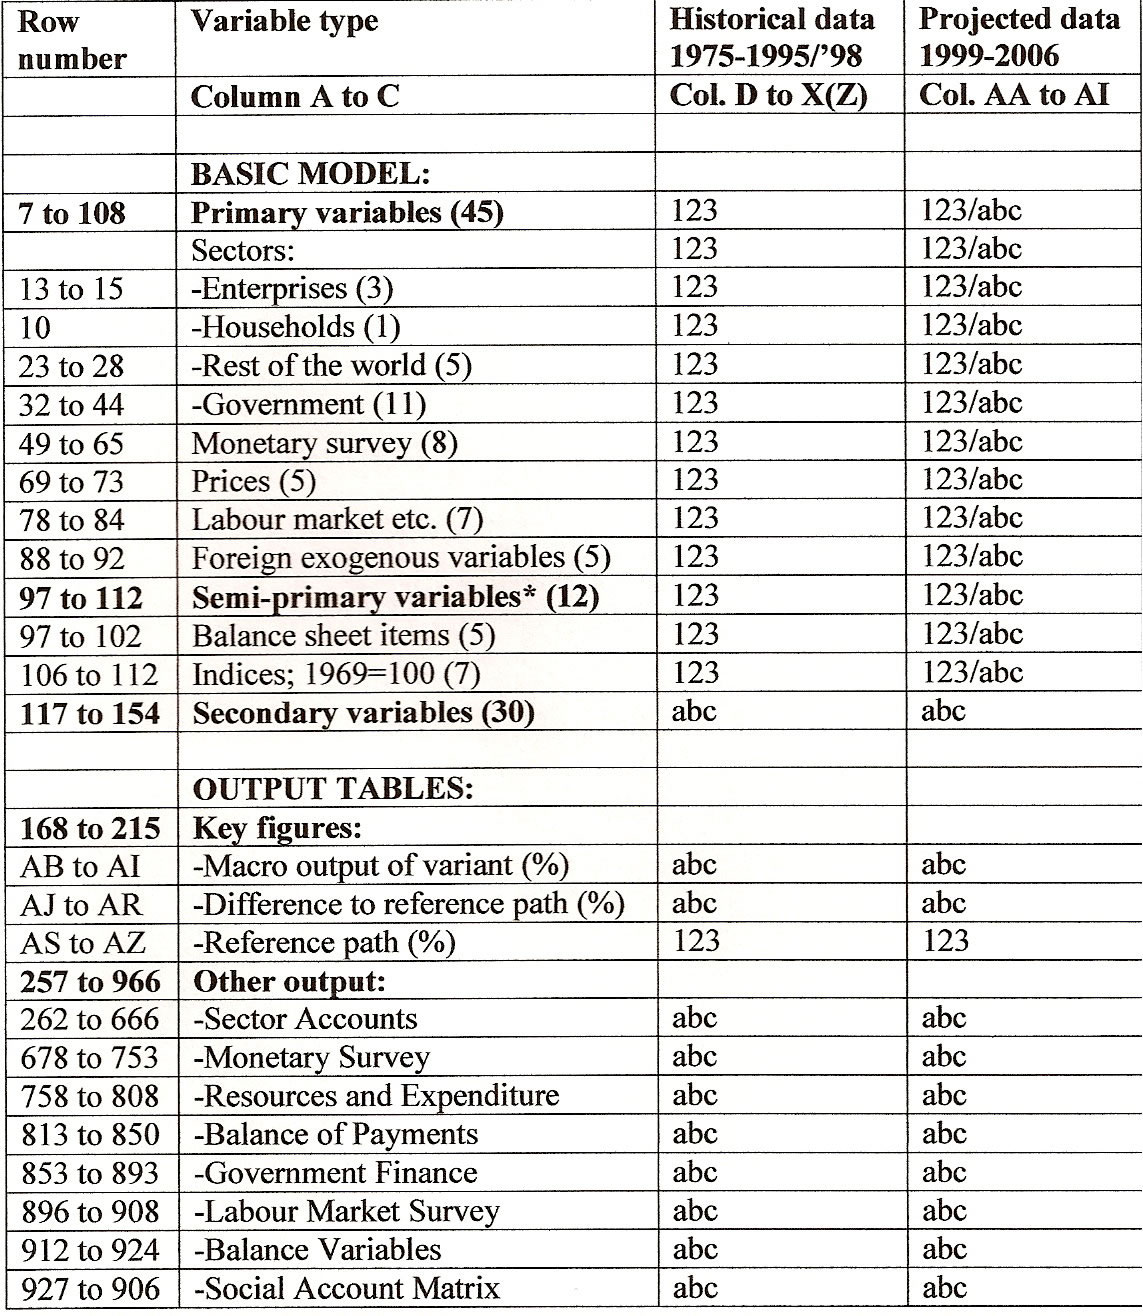
important to keep the schedule at hand. Table Schedule gives you a
first impression.
They can be found in lines 7 to 112. Values of these variables are
based on figures of European Commission, Eurostat, ECB, OECD, CPB and
IMF and on estimates of the CPB in accordance with its Quarterly
Bulletin. Values (indicated with 123 in table 2.1) of the 57 primary
variables for the period 1975 to 1995 are already filled in by MMC.
Then all following lines are filled in automatically on the basis of
formula calculations of the model (indicated with abc in table 2.1).
Formulas for 1999 are calibrated to deliver the same results as offical
prognoses. From these data and with help of formulas estimates will be
made for the years following 1999.
Schedule of Euralyse and its construction.3

|
(Semi) Behavioural equations
As
noted above, behavioural variables are calculated on the basis of other
variables in the spreadsheet and on the basis of behavioural
coefficients. The values of the behavioural coefficients are based on a
combination of time series analysis, economic theory, feasibility of
model results, and comparative studies. In the case of economies in
transition, historical research must be completed with these latter
components because the transition process affects behavioural
relationships, causing a structural change in the time series. If
possible, evidence from other countries assists the calibrations of the
present local statistics.
Below is a discussion
of the most important behavioural equations, and their significant
explanatory variables. The intention of the list below is to give an
idea of a starting point for discussions between the project team and
the counterparts.
- The export price is a function of import prices and wage costs.
- The change in the
quantity of exports is a function of the change in world trade, the
difference between export and import prices and production
capacity.
- Investments in industries are a function of gross value added of industries.
- The change in the value of consumption is a function of disposable income of wage earners and profits.
- The change in the
quantity of imports is a function of final output and import shares and
the difference between internal and external inflation.
- The growth of employment
in industries is a function of growth of the components of final output
and the corresponding labour intensities and relative wage costs.
- The change in unemployment rate is a function of demand for labour and the increase in labour supply.
- The change in the price of investment goods is a function of the change in costs.
- Money growth is a function of the monetary financing by government and the surplus on the balance of payments.
- The change in wage follows the consumption price and the change in unemployment.
- The change in the consumer price is a function of the change in costs and the change in the indirect tax rate.
The institutional or
semi-behavioural equations reflect the current institutional setting of
the country. Some of the most important equations of this type are:
- Import duties is a function of the value of imports and the average import duty rate.
- Taxes on consumption are a function of value of consumption and the VAT rate.
- Direct taxes on industries are a function of disposable profit income and the profit tax rate.
- Direct personal income tax is a function of disposable income and profits.
|
What has to be done?
A first version of Euralyse is
running and has been presented in workshops in December 1999 in The
Hague. However, a model is a living being and improvements never end:
- Research in improvement
of main equations: exchange rate, wage formation, investments. Study of
recent literature on these subjects. Comparison with models of IMF,
OESO, EU.
- Discussion of the first model version with colleague researchers.
- Documentation and full
description of the model following scientific standards: what's new in
Euralyse compared with other models? What are its weaknesses?
- How to use Euralyse
(model EU15) in combination with macro models of EEC countries, with
the Polish Macroabc model as an example.
- Construction of a version of Euralyse for the Euro area, using the new OESO database.
- Last but not least: use the model as an auxiliary in some research studies
|
|
|
|
